11 Plotting
Plotting docs.
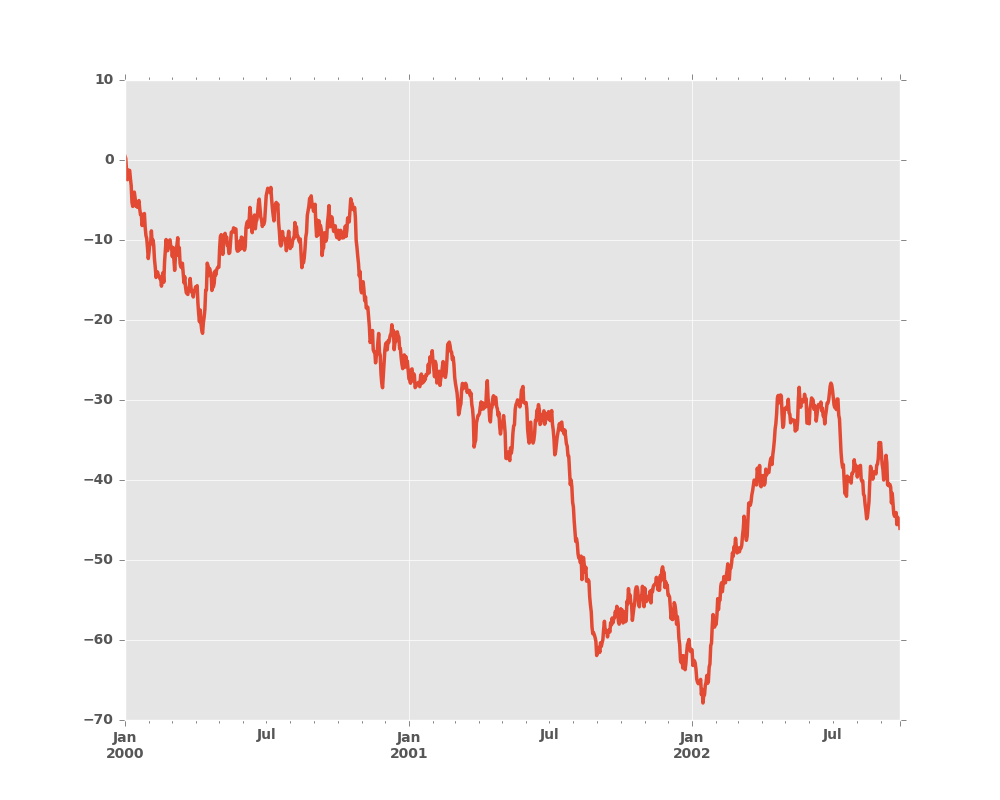
In [1]: ts = pd.Series(np.random.randn(1000), index=pd.date_range('1/1/2000', periods=1000))

In [2]: ts = ts.cumsum()

In [3]: ts.plot()
Out[3]: <matplotlib.axes._subplots.AxesSubplot at 0x2b358cdee250>
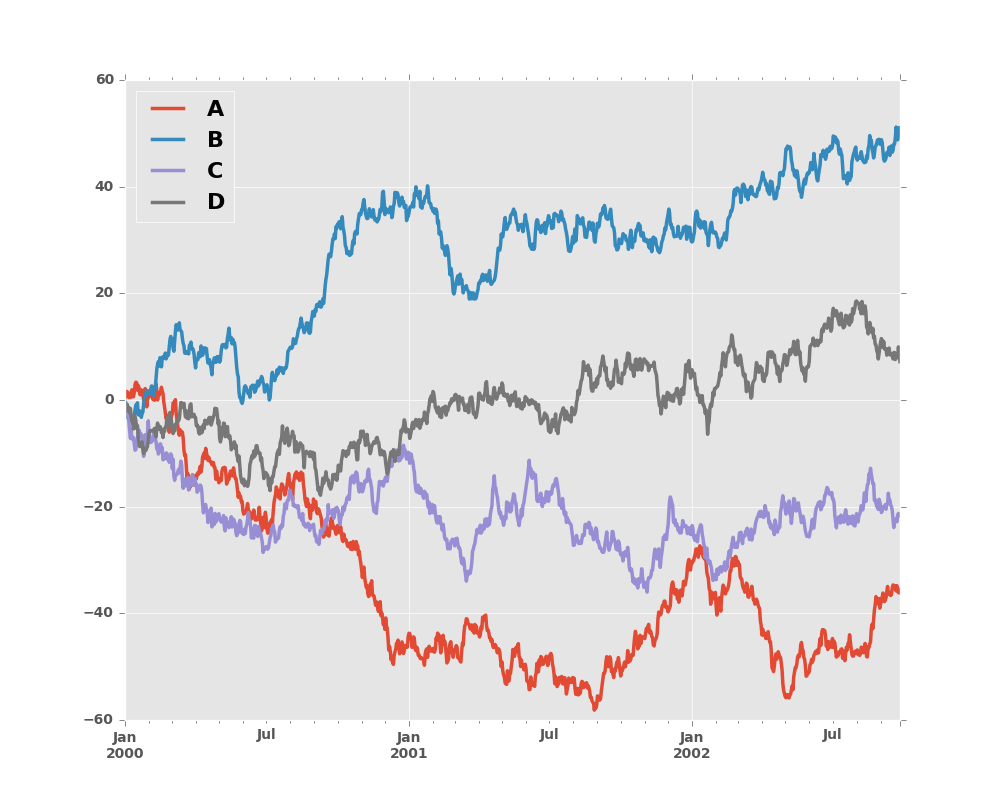
On DataFrame, plot() is a convenience to plot all of the
columns with labels:
In [4]: df = pd.DataFrame(np.random.randn(1000, 4), index=ts.index,
   ...:                   columns=['A', 'B', 'C', 'D'])
   ...:

In [5]: df = df.cumsum()

In [6]: plt.figure(); df.plot(); plt.legend(loc='best')
Out[6]: <matplotlib.legend.Legend at 0x2b35acb5fb10>