In [1]: import matplotlib as mpl

#mpl.rcParams['legend.fontsize']=20.0
#print mpl.matplotlib_fname() # location of the rc file
#print mpl.rcParams # current config
In [2]: print mpl.get_backend()
Qt5Agg
8.6 Plotting directly with matplotlib
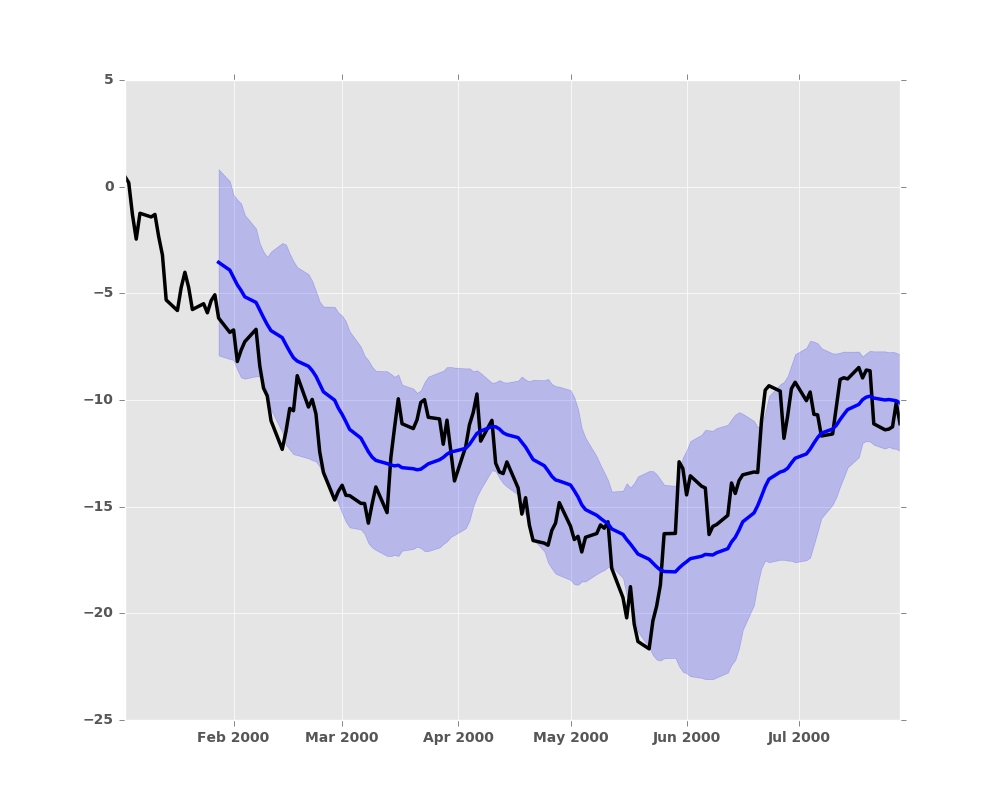
In some situations it may still be preferable or necessary to prepare plots directly with matplotlib, for instance when a certain type of plot or customization is not (yet) supported by pandas. Series and DataFrame objects behave like arrays and can therefore be passed directly to matplotlib functions without explicit casts.
pandas also automatically registers formatters and locators that recognize date indices, thereby extending date and time support to practically all plot types available in matplotlib. Although this formatting does not provide the same level of refinement you would get when plotting via pandas, it can be faster when plotting a large number of points.
Note
The speed up for large data sets only applies to pandas 0.14.0 and later.
In [3]: price = pd.Series(np.random.randn(150).cumsum(),
   ...:                   index=pd.date_range('2000-1-1', periods=150, freq='B'))
   ...:

In [4]: ma = price.rolling(20).mean()

In [5]: mstd = price.rolling(20).std()

In [6]: plt.figure()
Out[6]: <matplotlib.figure.Figure at 0x2b35e05a1650>

In [7]: plt.plot(price.index, price, 'k')
Out[7]: [<matplotlib.lines.Line2D at 0x2b35e05ee850>]

In [8]: plt.plot(ma.index, ma, 'b')
Out[8]: [<matplotlib.lines.Line2D at 0x2b35e063a210>]

In [9]: plt.fill_between(mstd.index, ma-2*mstd, ma+2*mstd, color='b', alpha=0.2)
Out[9]: <matplotlib.collections.PolyCollection at 0x2b35e063abd0>