6.1 Concatenating objects
The concat function (in the main pandas namespace) does all of the heavy
lifting of performing concatenation operations along an axis while performing
optional set logic (union or intersection) of the indexes (if any) on the other
axes. Note that I say “if any” because there is only a single possible axis of
concatenation for Series.
Before diving into all of the details of concat and what it can do, here is
a simple example:
In [1]: df1 = pd.DataFrame({'A': ['A0', 'A1', 'A2', 'A3'],
...: 'B': ['B0', 'B1', 'B2', 'B3'],
...: 'C': ['C0', 'C1', 'C2', 'C3'],
...: 'D': ['D0', 'D1', 'D2', 'D3']},
...: index=[0, 1, 2, 3])
...:
In [2]: df2 = pd.DataFrame({'A': ['A4', 'A5', 'A6', 'A7'],
...: 'B': ['B4', 'B5', 'B6', 'B7'],
...: 'C': ['C4', 'C5', 'C6', 'C7'],
...: 'D': ['D4', 'D5', 'D6', 'D7']},
...: index=[4, 5, 6, 7])
...:
In [3]: df3 = pd.DataFrame({'A': ['A8', 'A9', 'A10', 'A11'],
...: 'B': ['B8', 'B9', 'B10', 'B11'],
...: 'C': ['C8', 'C9', 'C10', 'C11'],
...: 'D': ['D8', 'D9', 'D10', 'D11']},
...: index=[8, 9, 10, 11])
...:
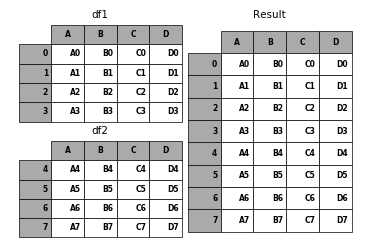
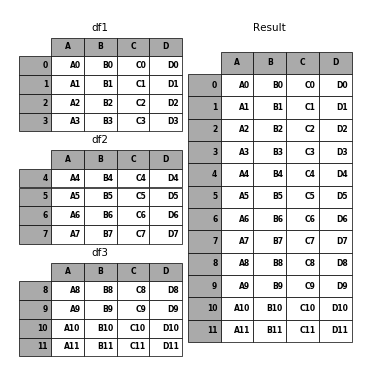
In [4]: frames = [df1, df2, df3]
In [5]: result = pd.concat(frames)
In [6]: p.plot(frames, result,labels=['df1', 'df2', 'df3'], vertical=True);

Like its sibling function on ndarrays, numpy.concatenate, pandas.concat
takes a list or dict of homogeneously-typed objects and concatenates them with
some configurable handling of “what to do with the other axes”:
pd.concat(objs, axis=0, join='outer', join_axes=None, ignore_index=False,
          keys=None, levels=None, names=None, verify_integrity=False)
objs: a sequence or mapping of Series, DataFrame, or Panel objects. If a dict is passed, the sorted keys will be used as the keys argument, unless it is passed, in which case the values will be selected (see below). Any None objects will be dropped silently unless they are all None in which case a ValueError will be raised.axis: {0, 1, ...}, default 0. The axis to concatenate along.join: {‘inner’, ‘outer’}, default ‘outer’. How to handle indexes on other axis(es). Outer for union and inner for intersection.join_axes: list of Index objects. Specific indexes to use for the other n - 1 axes instead of performing inner/outer set logic.keys: sequence, default None. Construct hierarchical index using the passed keys as the outermost level. If multiple levels passed, should contain tuples.levels: list of sequences, default None. Specific levels (unique values) to use for constructing a MultiIndex. Otherwise they will be inferred from the keys.names: list, default None. Names for the levels in the resulting hierarchical index.verify_integrity: boolean, default False. Check whether the new concatenated axis contains duplicates. This can be very expensive relative to the actual data concatenation.ignore_index: boolean, default False. If True, do not use the index values on the concatenation axis. The resulting axis will be labeled 0, ..., n - 1. This is useful if you are concatenating objects where the concatenation axis does not have meaningful indexing information. Note the index values on the other axes are still respected in the join.copy: boolean, default True. If False, do not copy data unnecessarily.
Without a little bit of context and example many of these arguments don’t make
much sense. Let’s take the above example. Suppose we wanted to associate
specific keys with each of the pieces of the chopped up DataFrame. We can do
this using the keys argument:
In [7]: result = pd.concat(frames, keys=['x', 'y', 'z'])
In [8]: p.plot(frames, result,labels=['df1', 'df2', 'df3'], vertical=True)
Out[8]: <matplotlib.figure.Figure at 0x2b35b9f1fb50>

As you can see (if you’ve read the rest of the documentation), the resulting object’s index has a hierarchical index. This means that we can now do stuff like select out each chunk by key:
In [9]: result.ix['y']
Out[9]:
    A   B   C   D
4  A4  B4  C4  D4
5  A5  B5  C5  D5
6  A6  B6  C6  D6
7  A7  B7  C7  D7
It’s not a stretch to see how this can be very useful. More detail on this functionality below.
Note
It is worth noting however, that concat (and therefore append) makes
a full copy of the data, and that constantly reusing this function can
create a significant performance hit. If you need to use the operation over
several datasets, use a list comprehension.
frames = [ process_your_file(f) for f in files ]
result = pd.concat(frames)
6.1.1 Set logic on the other axes
When gluing together multiple DataFrames (or Panels or...), for example, you have a choice of how to handle the other axes (other than the one being concatenated). This can be done in three ways:
- Take the (sorted) union of them all,
join='outer'. This is the default option as it results in zero information loss. - Take the intersection,
join='inner'. - Use a specific index (in the case of DataFrame) or indexes (in the case of
Panel or future higher dimensional objects), i.e. the
join_axesargument
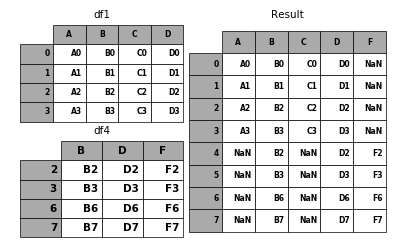
Here is a example of each of these methods. First, the default join='outer'
behavior:
In [10]: df4 = pd.DataFrame({'B': ['B2', 'B3', 'B6', 'B7'],
   ....:                  'D': ['D2', 'D3', 'D6', 'D7'],
   ....:                  'F': ['F2', 'F3', 'F6', 'F7']},
   ....:                 index=[2, 3, 6, 7])
   ....:

In [11]: result = pd.concat([df1, df4], axis=1)
In [12]: p.plot([df1, df4], result,labels=['df1', 'df4'], vertical=False);
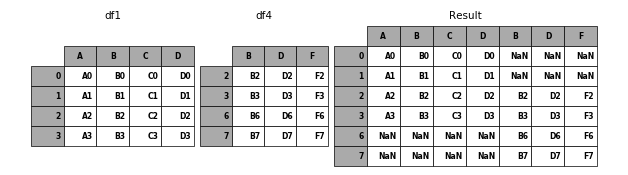
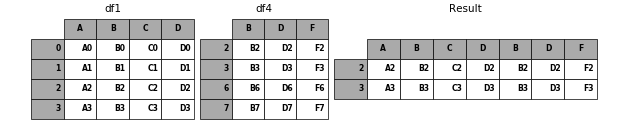
Note that the row indexes have been unioned and sorted. Here is the same thing
with join='inner':
In [13]: result = pd.concat([df1, df4], axis=1, join='inner')
In [14]: p.plot([df1, df4], result,labels=['df1', 'df4'], vertical=False);
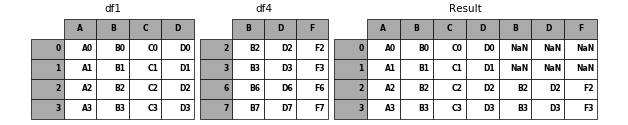
Lastly, suppose we just wanted to reuse the exact index from the original DataFrame:
In [15]: result = pd.concat([df1, df4], axis=1, join_axes=[df1.index])
In [16]: p.plot([df1, df4], result,labels=['df1', 'df4'], vertical=False);

In [17]: plt.close('all');
6.1.2 Concatenating using append
A useful shortcut to concat are the append instance methods on Series
and DataFrame. These methods actually predated concat. They concatenate
along axis=0, namely the index:
In [18]: result = df1.append(df2)
In [19]: p.plot([df1, df2], result,labels=['df1', 'df2'], vertical=True);
In the case of DataFrame, the indexes must be disjoint but the columns do not need to be:
In [20]: result = df1.append(df4)
In [21]: p.plot([df1, df4], result,labels=['df1', 'df4'], vertical=True);

append may take multiple objects to concatenate:
In [22]: result = df1.append([df2, df3])
In [23]: p.plot([df1, df2, df3], result,labels=['df1', 'df2', 'df3'], vertical=True);

In [24]: plt.close('all');
Note
Unlike list.append method, which appends to the original list and
returns nothing, append here does not modify df1 and
returns its copy with df2 appended.
6.1.3 Ignoring indexes on the concatenation axis
For DataFrames which don’t have a meaningful index, you may wish to append them and ignore the fact that they may have overlapping indexes:
To do this, use the ignore_index argument:
In [25]: result = pd.concat([df1, df4], ignore_index=True)
In [26]: p.plot([df1, df4], result,labels=['df1', 'df4'], vertical=True);

This is also a valid argument to DataFrame.append:
In [27]: result = df1.append(df4, ignore_index=True)
In [28]: p.plot([df1, df4], result,labels=['df1', 'df4'], vertical=True);
6.1.4 Concatenating with mixed ndims
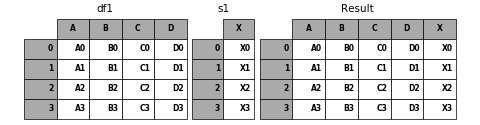
You can concatenate a mix of Series and DataFrames. The Series will be transformed to DataFrames with the column name as the name of the Series.
In [29]: s1 = pd.Series(['X0', 'X1', 'X2', 'X3'], name='X')

In [30]: result = pd.concat([df1, s1], axis=1)
In [31]: p.plot([df1, s1], result,labels=['df1', 's1'], vertical=False);
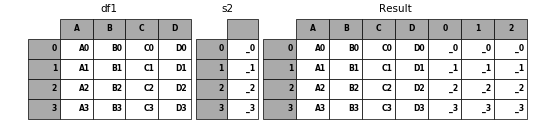
If unnamed Series are passed they will be numbered consecutively.
In [32]: s2 = pd.Series(['_0', '_1', '_2', '_3'])

In [33]: result = pd.concat([df1, s2, s2, s2], axis=1)
In [34]: p.plot([df1, s2], result,labels=['df1', 's2'], vertical=False);
Passing ignore_index=True will drop all name references.
In [35]: result = pd.concat([df1, s1], axis=1, ignore_index=True)
In [36]: p.plot([df1, s1], result,labels=['df1', 's1'], vertical=False);

In [37]: plt.close('all');

6.1.5 More concatenating with group keys
A fairly common use of the keys argument is to override the column names when creating a new DataFrame based on existing Series.
Notice how the default behaviour consists on letting the resulting DataFrame inherits the parent Series’ name, when these existed.
In [38]: s3 = pd.Series([0, 1, 2, 3], name='foo')

In [39]: s4 = pd.Series([0, 1, 2, 3])

In [40]: s5 = pd.Series([0, 1, 4, 5])

In [41]: pd.concat([s3, s4, s5], axis=1)
Out[41]:
   foo  0  1
0    0  0  0
1    1  1  1
2    2  2  4
3    3  3  5
Through the keys argument we can override the existing column names.
In [42]: pd.concat([s3, s4, s5], axis=1, keys=['red','blue','yellow'])
Out[42]:
   red  blue  yellow
0    0     0       0
1    1     1       1
2    2     2       4
3    3     3       5
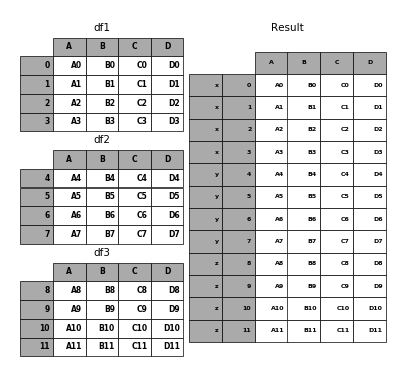
Let’s consider now a variation on the very first example presented:
In [43]: result = pd.concat(frames, keys=['x', 'y', 'z'])
In [44]: p.plot(frames, result,labels=['df1', 'df2', 'df3'], vertical=True);

You can also pass a dict to concat in which case the dict keys will be used
for the keys argument (unless other keys are specified):
In [45]: pieces = {'x': df1, 'y': df2, 'z': df3}

In [46]: result = pd.concat(pieces)
In [47]: p.plot([df1, df2, df3], result,labels=['df1', 'df2', 'df3'], vertical=True);
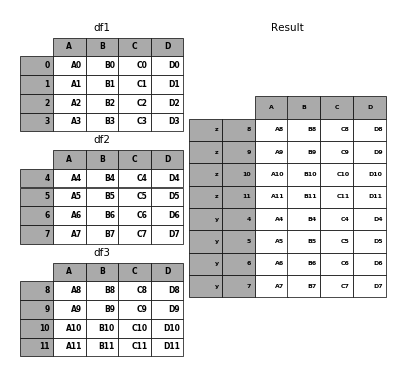
In [48]: result = pd.concat(pieces, keys=['z', 'y'])
In [49]: p.plot([df1, df2, df3], result,labels=['df1', 'df2', 'df3'], vertical=True);
The MultiIndex created has levels that are constructed from the passed keys and the index of the DataFrame pieces:
In [50]: result.index.levels
Out[50]: FrozenList([[u'z', u'y'], [4, 5, 6, 7, 8, 9, 10, 11]])
If you wish to specify other levels (as will occasionally be the case), you can
do so using the levels argument:
In [51]: result = pd.concat(pieces, keys=['x', 'y', 'z'],
   ....:                 levels=[['z', 'y', 'x', 'w']],
   ....:                 names=['group_key'])
   ....:
In [52]: p.plot([df1, df2, df3], result,labels=['df1', 'df2', 'df3'], vertical=True);

In [53]: plt.close('all');

In [54]: result.index.levels
Out[54]: FrozenList([[u'z', u'y', u'x', u'w'], [0, 1, 2, 3, 4, 5, 6, 7, 8, 9, 10, 11]])
Yes, this is fairly esoteric, but is actually necessary for implementing things like GroupBy where the order of a categorical variable is meaningful.
6.1.6 Appending rows to a DataFrame
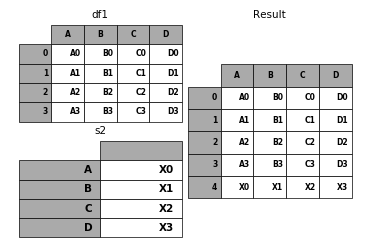
While not especially efficient (since a new object must be created), you can
append a single row to a DataFrame by passing a Series or dict to append,
which returns a new DataFrame as above.
In [55]: s2 = pd.Series(['X0', 'X1', 'X2', 'X3'], index=['A', 'B', 'C', 'D'])

In [56]: result = df1.append(s2, ignore_index=True)
In [57]: p.plot([df1, s2], result,labels=['df1', 's2'], vertical=True);
You should use ignore_index with this method to instruct DataFrame to
discard its index. If you wish to preserve the index, you should construct an
appropriately-indexed DataFrame and append or concatenate those objects.
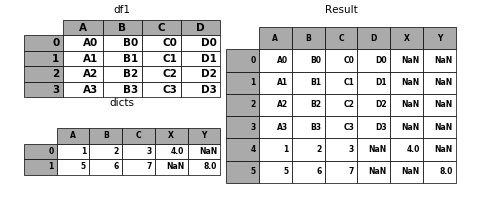
You can also pass a list of dicts or Series:
In [58]: dicts = [{'A': 1, 'B': 2, 'C': 3, 'X': 4},
   ....:          {'A': 5, 'B': 6, 'C': 7, 'Y': 8}]
   ....:

In [59]: result = df1.append(dicts, ignore_index=True)
In [60]: p.plot([df1, pd.DataFrame(dicts)], result,labels=['df1', 'dicts'], vertical=True);

In [61]: plt.close('all');