3.4 Expanding Windows
A common alternative to rolling statistics is to use an expanding window, which yields the value of the statistic with all the data available up to that point in time.
These follow a similar interface to .rolling, with the .expanding method
returning an Expanding object.
As these calculations are a special case of rolling statistics, they are implemented in pandas such that the following two calls are equivalent:
In [1]: df.rolling(window=len(df), min_periods=1).mean()[:5]
Out[1]:
                   A         B         C         D
2000-01-01 -0.218470 -0.061645 -0.723780  0.551225
2000-01-02 -0.467353  0.357114 -0.172157 -0.007968
2000-01-03 -0.731308  0.165367  0.514631 -0.303931
2000-01-04 -1.003844  0.069892  0.877411 -0.204479
2000-01-05 -1.505896  0.107398  0.957243 -0.025130

In [2]: df.expanding(min_periods=1).mean()[:5]
Out[2]:
                   A         B         C         D
2000-01-01 -0.218470 -0.061645 -0.723780  0.551225
2000-01-02 -0.467353  0.357114 -0.172157 -0.007968
2000-01-03 -0.731308  0.165367  0.514631 -0.303931
2000-01-04 -1.003844  0.069892  0.877411 -0.204479
2000-01-05 -1.505896  0.107398  0.957243 -0.025130
These have a similar set of methods to .rolling methods.
3.4.1 Method Summary
| Function | Description |
|---|---|
count() |
Number of non-null observations |
sum() |
Sum of values |
mean() |
Mean of values |
median() |
Arithmetic median of values |
min() |
Minimum |
max() |
Maximum |
std() |
Unbiased standard deviation |
var() |
Unbiased variance |
skew() |
Unbiased skewness (3rd moment) |
kurt() |
Unbiased kurtosis (4th moment) |
quantile() |
Sample quantile (value at %) |
apply() |
Generic apply |
cov() |
Unbiased covariance (binary) |
corr() |
Correlation (binary) |
Aside from not having a window parameter, these functions have the same
interfaces as their .rolling counterparts. Like above, the parameters they
all accept are:
min_periods: threshold of non-null data points to require. Defaults to minimum needed to compute statistic. NoNaNswill be output oncemin_periodsnon-null data points have been seen.center: boolean, whether to set the labels at the center (default is False)
Note
The output of the .rolling and .expanding methods do not return a
NaN if there are at least min_periods non-null values in the current
window. This differs from cumsum, cumprod, cummax, and
cummin, which return NaN in the output wherever a NaN is
encountered in the input.
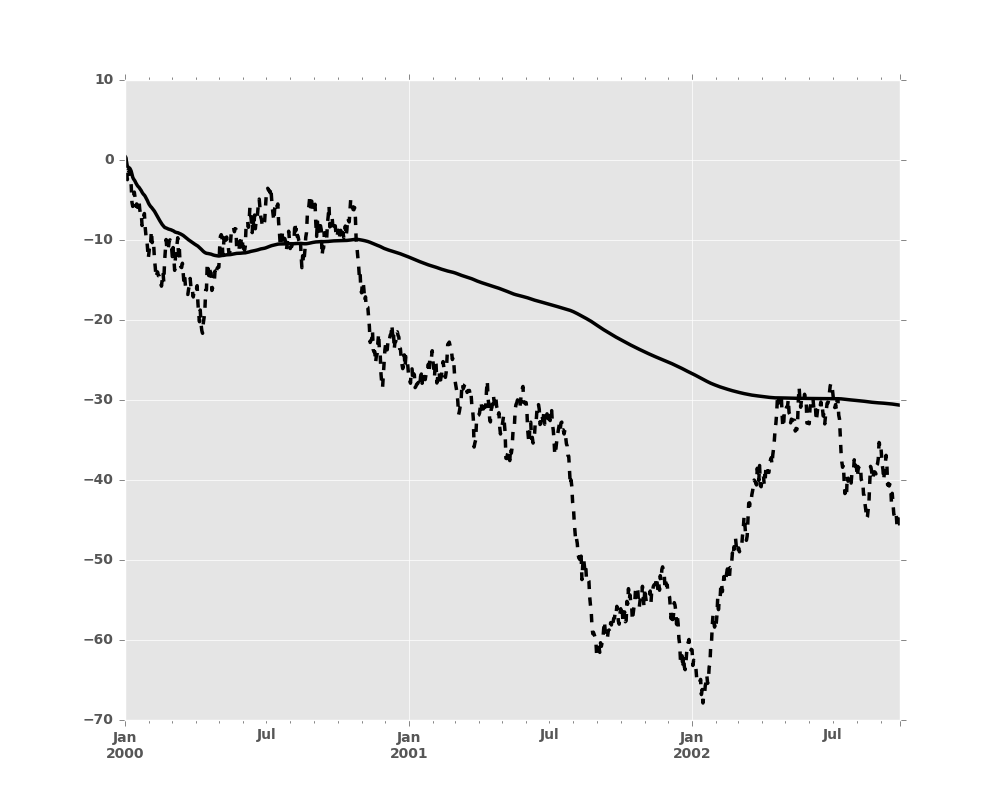
An expanding window statistic will be more stable (and less responsive) than
its rolling window counterpart as the increasing window size decreases the
relative impact of an individual data point. As an example, here is the
mean() output for the previous time series dataset:
In [3]: s.plot(style='k--')
Out[3]: <matplotlib.axes._subplots.AxesSubplot at 0x2b35b9e1f250>

In [4]: s.expanding().mean().plot(style='k')
Out[4]: <matplotlib.axes._subplots.AxesSubplot at 0x2b35b9e1f250>