5.6 Transformation
The transform method returns an object that is indexed the same (same size)
as the one being grouped. Thus, the passed transform function should return a
result that is the same size as the group chunk. For example, suppose we wished
to standardize the data within each group:
In [1]: index = pd.date_range('10/1/1999', periods=1100)

In [2]: ts = pd.Series(np.random.normal(0.5, 2, 1100), index)

In [3]: ts = ts.rolling(window=100,min_periods=100).mean().dropna()

In [4]: ts.head()
Out[4]:
2000-01-08    0.073603
2000-01-09    0.057313
2000-01-10    0.089255
2000-01-11    0.133248
2000-01-12    0.175876
Freq: D, dtype: float64

In [5]: ts.tail()
Out[5]:
2002-09-30    0.858589
2002-10-01    0.863873
2002-10-02    0.885344
2002-10-03    0.878466
2002-10-04    0.919510
Freq: D, dtype: float64

In [6]: key = lambda x: x.year

In [7]: zscore = lambda x: (x - x.mean()) / x.std()

In [8]: transformed = ts.groupby(key).transform(zscore)
We would expect the result to now have mean 0 and standard deviation 1 within each group, which we can easily check:
# Original Data
In [9]: grouped = ts.groupby(key)

In [10]: grouped.mean()
Out[10]:
2000    0.407865
2001    0.358106
2002    0.619029
dtype: float64

In [11]: grouped.std()
Out[11]:
2000    0.180659
2001    0.227780
2002    0.296282
dtype: float64

# Transformed Data
In [12]: grouped_trans = transformed.groupby(key)

In [13]: grouped_trans.mean()
Out[13]:
2000   -1.662242e-17
2001    7.592100e-16
2002   -4.344699e-16
dtype: float64

In [14]: grouped_trans.std()
Out[14]:
2000    1.0
2001    1.0
2002    1.0
dtype: float64
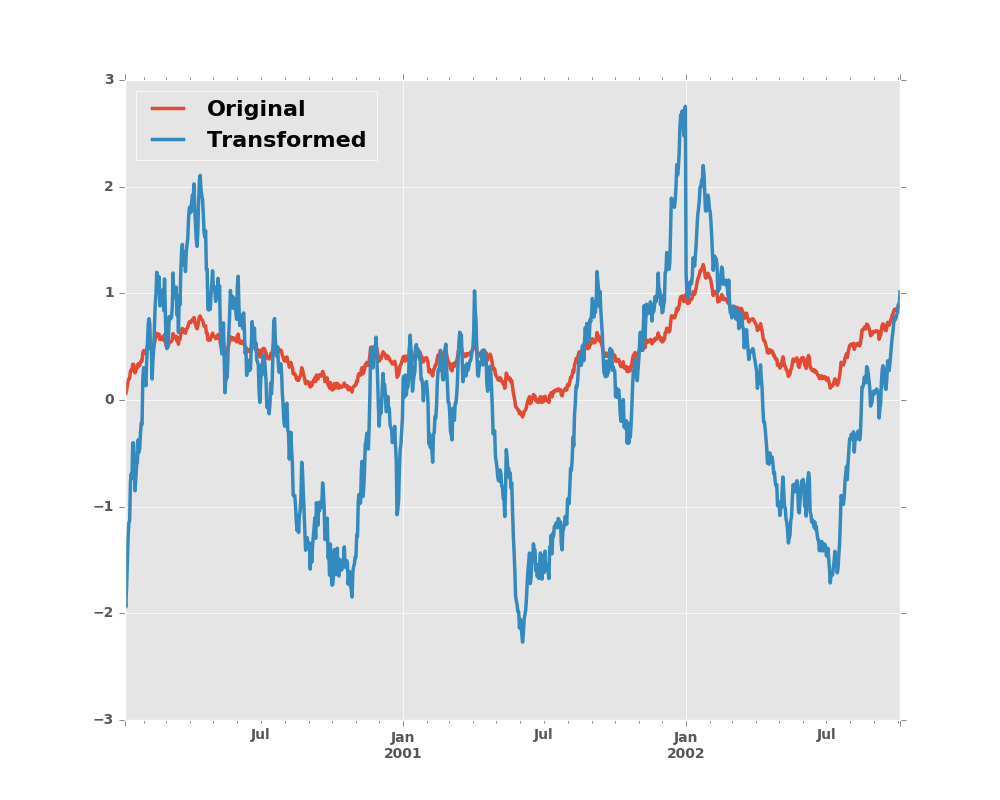
We can also visually compare the original and transformed data sets.
In [15]: compare = pd.DataFrame({'Original': ts, 'Transformed': transformed})

In [16]: compare.plot()
Out[16]: <matplotlib.axes._subplots.AxesSubplot at 0x2b35be9a4a90>
Another common data transform is to replace missing data with the group mean.
In [17]: data_df
Out[17]:
            A         B         C
0   -0.786641 -0.393609 -0.171092
1    1.786173 -0.575189  0.820750
2   -1.256530 -0.642246  0.236892
3   -0.466867 -1.382653 -0.369422
4         NaN -0.851236  1.058006
5   -0.080372 -1.268121  1.561967
6    0.816983  1.965656 -1.169408
..        ...       ...       ...
993       NaN -0.575634 -2.332083
994  0.225519  0.347968 -0.517897
995  0.945827  0.190394  0.845686
996  0.607557  0.722559  0.737809
997  0.024958  0.553376  0.477220
998  0.647037 -0.397862 -0.022409
999  0.929380  0.232026 -1.296769

[1000 rows x 3 columns]

In [18]: countries = np.array(['US', 'UK', 'GR', 'JP'])

In [19]: key = countries[np.random.randint(0, 4, 1000)]

In [20]: grouped = data_df.groupby(key)

# Non-NA count in each group
In [21]: grouped.count()
Out[21]:
      A    B    C
GR  208  221  189
JP  235  251  215
UK  235  239  217
US  230  239  202

In [22]: f = lambda x: x.fillna(x.mean())

In [23]: transformed = grouped.transform(f)
We can verify that the group means have not changed in the transformed data and that the transformed data contains no NAs.
In [24]: grouped_trans = transformed.groupby(key)

In [25]: grouped.mean() # original group means
Out[25]:
           A         B         C
GR  0.032022  0.037422  0.007687
JP -0.049426 -0.008097 -0.092958
UK  0.072942  0.059592  0.176494
US -0.016772 -0.075033 -0.086060

In [26]: grouped_trans.mean() # transformation did not change group means
Out[26]:
           A         B         C
GR  0.032022  0.037422  0.007687
JP -0.049426 -0.008097 -0.092958
UK  0.072942  0.059592  0.176494
US -0.016772 -0.075033 -0.086060

In [27]: grouped.count() # original has some missing data points
Out[27]:
      A    B    C
GR  208  221  189
JP  235  251  215
UK  235  239  217
US  230  239  202

In [28]: grouped_trans.count() # counts after transformation
Out[28]:
      A    B    C
GR  234  234  234
JP  261  261  261
UK  255  255  255
US  250  250  250

In [29]: grouped_trans.size() # Verify non-NA count equals group size
Out[29]:
GR    234
JP    261
UK    255
US    250
dtype: int64
Note
Some functions when applied to a groupby object will automatically transform the input, returning
an object of the same shape as the original. Passing as_index=False will not affect these transformation methods.
For example: fillna, ffill, bfill, shift.
In [30]: grouped.ffill()
Out[30]:
            A         B         C
0   -0.786641 -0.393609 -0.171092
1    1.786173 -0.575189  0.820750
2   -1.256530 -0.642246  0.236892
3   -0.466867 -1.382653 -0.369422
4   -0.786641 -0.851236  1.058006
5   -0.080372 -1.268121  1.561967
6    0.816983  1.965656 -1.169408
..        ...       ...       ...
993 -0.661776 -0.575634 -2.332083
994  0.225519  0.347968 -0.517897
995  0.945827  0.190394  0.845686
996  0.607557  0.722559  0.737809
997  0.024958  0.553376  0.477220
998  0.647037 -0.397862 -0.022409
999  0.929380  0.232026 -1.296769

[1000 rows x 3 columns]